
How to Build a Customer Journey Map (With Free Template)
Most product teams think they understand their users. Then they build a customer journey map and realize they’ve been solving symptoms instead of root causes. They discover friction at a stage they thought was fine. They find delight at a touchpoint they almost cut. A customer journey map doesn’t just document what users do — it shows you where the experience breaks down, where trust is lost, and where your product has the most leverage to create real value.
This exact realization tends to play out the same way in a room full of confident PMs and designers: everyone nods along through the awareness and sign-up stages, then goes quiet at the stage nobody had actually looked at closely. That silence is usually the most useful five minutes of the whole workshop.
What Is a Customer Journey Map?
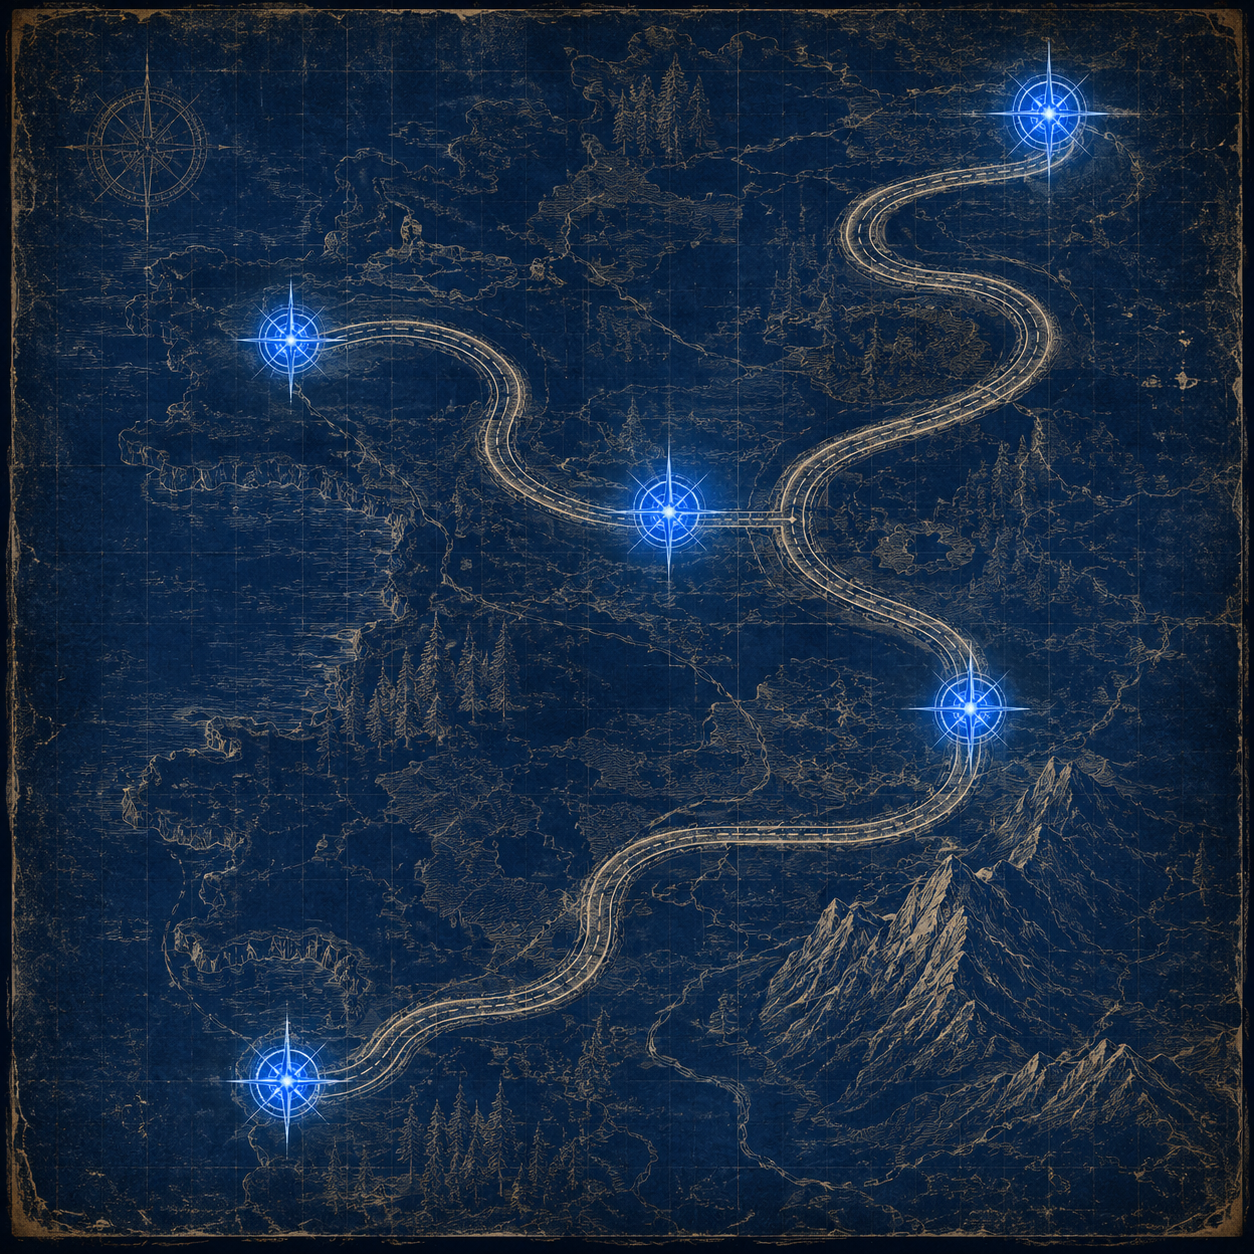
A customer journey map is a visual document that traces the experience of a specific type of user — a persona — as they move through a process, product, or relationship with your company. Nielsen Norman Group’s definition keeps it simple: a journey map is a visualization of the process a person goes through to accomplish a goal. It captures the stages of that journey, the actions the user takes at each stage, their thoughts and emotions, the touchpoints they interact with, and the pain points they encounter along the way.
Customer journey maps aren’t UX deliverables. They’re product strategy tools. When built from real user data, a customer journey map shows you exactly where your product is creating friction, where users are dropping off, and where the gap between what users expect and what they actually experience is widest. That gap is where product opportunities live.
Why Product Managers Need a Customer Journey Map
Product roadmaps are easy to fill with features. The harder question is whether those features address the right moments in the user’s experience. A customer journey map keeps you anchored to the actual sequence of events your users go through — not the idealized version you imagine.
For product managers specifically, a journey map does several jobs at once. It aligns your cross-functional team around a shared understanding of the user experience. It makes it easier to prioritize work by connecting features to specific journey stages. It surfaces research gaps — places where you’re making assumptions instead of working from data. And it gives you a framework for communicating with stakeholders about why you’re prioritizing what you’re prioritizing. A journey map can end a stakeholder argument about which of two features matters more almost by itself — once both sides can point to the same emotional dip on the same map, the argument mostly resolves, because both sides are finally disagreeing about the same thing instead of past each other.
Key Components of a Customer Journey Map
Before you start building, understand the layers that go into a complete journey map.
Persona — The specific user type this map represents. Don’t try to map the journey for “all users.” Pick one persona with a clear goal and map their experience. Grounding the persona’s goal in jobs-to-be-done thinking keeps the map focused on what the user is actually trying to accomplish, not a demographic description. You can always build additional maps for other personas later.
Stages — The high-level phases the user moves through. For a SaaS product, this might be: Awareness → Consideration → Sign-up → Onboarding → First value → Regular use → Advocacy. Define stages based on your user’s experience, not your internal funnel.
Actions — What the user actually does at each stage. These should be concrete and behavioral — “searches for comparison reviews,” “starts free trial,” “invites a teammate” — not vague generalizations.
Thoughts — What the user is thinking at each stage. What questions do they have? What are they trying to figure out? This layer is often informed by running user interviews and synthesizing what users actually say.
Emotions — How the user feels at each stage. Is this stage exciting, confusing, frustrating, or reassuring? Plot emotions on a simple high/low curve across the journey. The dips are your highest-priority problem areas.
Pain Points — Where the experience breaks down. What’s causing friction, confusion, or drop-off at each stage?
Opportunities — What your team could do to improve the experience at each stage. These become inputs to your roadmap.
Touchpoints — Every channel or interface the user interacts with — email, in-app, support, website, sales. Knowing all the touchpoints at each stage helps you see the full picture of what the user is navigating.
How to Build a Customer Journey Map Step by Step
Step 1: Define your scope. Choose a specific persona and a specific goal or process to map. “The journey of a new mid-market user from first sign-up to completing their first project” is a good scope. “The journey of all our users” is not.
Step 2: Gather your research. A customer journey map built from assumptions is a fictional document. Before you build, gather real data: user interview transcripts, session recordings, support tickets, onboarding drop-off data, NPS survey responses, and any existing quantitative behavioral data you have. Your continuous discovery habits — regular user interviews and research touchpoints — are the input machine that keeps your journey map current. Teams that try to shortcut this step because they “already know” their users are frequently surprised: a map built that way often matches almost none of what comes out of five interviews run two weeks later to sanity-check it.
Step 3: Identify the stages. Based on your research, define the major phases of the user’s journey. Aim for 4–7 stages. Too few and you lose nuance. Too many and the map becomes unusable.
Step 4: Fill in the actions, thoughts, and emotions. For each stage, document what the user is doing, what they’re thinking, and how they’re feeling. Draw from your research as much as possible. Where you have gaps, note them as assumptions to validate.
Step 5: Map the touchpoints and pain points. Identify every channel and interface the user encounters at each stage. For each touchpoint, note the pain points — what’s creating friction, confusion, or failure.
Step 6: Plot the emotional curve. Draw a simple line across the top of your map showing how the user’s emotional state rises and falls across stages. This single visual element is often the most useful part of the map — it immediately shows you where the experience deteriorates.
Step 7: Identify opportunities. For each dip in the emotional curve, identify at least one potential product improvement or intervention. These become your opportunity backlog.
Step 8: Validate and update. Share the map with your team and with users. Does it reflect their experience? What’s missing? It’s a living document — it should be updated as your product changes and as you gather more research. A product discovery sprint is a great mechanism for refreshing your journey maps every quarter.
Customer Journey Map Template
Use this table as your starting framework. Build it in Miro, FigJam, Notion, or a simple spreadsheet.
| Stage 1: Awareness | Stage 2: Consideration | Stage 3: Onboarding | Stage 4: First Value | Stage 5: Adoption | |
|---|---|---|---|---|---|
| User Goal | |||||
| Actions | |||||
| Thoughts | |||||
| Emotions | 😐 | 🙂 | 😟 | 😊 | 😄 |
| Touchpoints | |||||
| Pain Points | |||||
| Opportunities |
Tips for using this template:
- Use sticky notes or color-coding to show confidence level (green = validated, yellow = assumed, red = gap)
- Add a row for “Internal owner” to assign accountability for each stage
- Review and update every quarter or after major product changes
Customer Journey Map Examples
Example 1: B2B SaaS onboarding journey. At a 30-person project management SaaS company, a team mapped the journey of a new team admin from first login to having their entire team actively using the product. The emotional curve showed a strong dip at the “invite teammates” stage, where the admin had to get five to ten colleagues to accept invites and set up accounts — and most admins gave up after two follow-up nudges. That friction point became the focus of a new onboarding initiative: an automated email sequence that handled teammate invitations with a single click from the admin’s side. Invite acceptance went from roughly 40% to 68% within the first month of the new flow.
Example 2: E-commerce checkout experience. A consumer product company maps the purchase journey from product discovery to post-delivery. The emotional curve shows a spike of anxiety during the payment and shipping estimate stage. Users are unsure whether their order will arrive on time. The opportunity: surface delivery estimates earlier in the journey — before the user adds the item to their cart — to reduce checkout abandonment.
These examples show the same pattern: the emotional dip tells you where to look, the pain points tell you what’s wrong, and the opportunity layer tells you what to build.
Where Customer Journey Maps Break Down
Building from assumptions. This is the most common and most damaging mistake. If your journey map doesn’t come from real user data, it reflects your team’s beliefs about the user experience, not the user’s actual experience. Those are often very different things. A widely cited practitioner survey from Nielsen Norman Group found that most journey-mapping teams build maps collaboratively rather than solo — and that collaboration is often exactly what catches an assumption before it hardens into a “fact” nobody questions again.
Creating a “happy path” map. If your journey map shows a smooth, positive experience throughout, you haven’t done the work. Real user journeys have friction, confusion, and failure points. Fix: if every stage on your map looks fine, go back and interview five more users specifically about the stage you’re least confident in.
Mapping too broadly. Trying to map all users, all touchpoints, and all scenarios at once produces a document so complex it’s unusable. Start with one persona and one core use case. Expand from there.
Treating it as a one-time exercise. A customer journey map built in 2024 doesn’t reflect your product in 2026. If your map isn’t updated regularly, it becomes misleading. Fix: put a recurring calendar hold on the books, tied to a discovery sprint, rather than trusting that “someone will update it eventually” — that someone rarely does.
How to Use Your Customer Journey Map to Drive Product Decisions
The real value of a customer journey map is what you do with it after you build it.
First, use it to prioritize. When you’re building your roadmap, reference the journey map to make sure the features you’re prioritizing address real friction points in the user experience — not just nice-to-haves that sound appealing in a meeting. Running the opportunities from your map through a RICE scoring pass turns “this stage feels bad” into a ranked list you can actually defend in planning.
Second, use it to align your team. Share the journey map in sprint planning, design reviews, and stakeholder presentations. When everyone can see the same picture of the user experience, it’s much easier to agree on what matters.
Third, use it to spot research gaps. Anywhere on your map where you’ve marked something as an assumption is a research question waiting to be answered. Use that to plan your next round of user interviews.
Fourth, use it to measure progress. After you ship improvements at a specific journey stage, go back and update the emotional curve. Has the friction point improved? How has the data changed? The map becomes a before-and-after record of the product work you’ve done and its impact on the actual user experience.
Build the Map Before Your Next Roadmap Review
A customer journey map is one of those documents teams often skip because it takes real effort to build well, not because it doesn’t work. Pick one persona, block two hours with your research notes actually open in front of you, and get a first draft on the wall before your next roadmap review — a rough map built from five real interviews will tell you more than a polished one built from guesses.
References
- Nielsen Norman Group — “Journey Mapping 101” — nngroup.com/articles/journey-mapping-101
- Nielsen Norman Group — “How Practitioners Create Journey Maps” — nngroup.com/articles/journey-mapping-how
- Interaction Design Foundation — “Customer Journey Map” — ixdf.org/literature/topics/customer-journey-map
- Teresa Torres — “Continuous Discovery Habits” — producttalk.org