
Prioritization for Gaming Product Teams: Live-Ops vs. Core Loop Investment
A live-ops calendar is not a prioritization problem. It is an operations load. Operations load has a known behaviour: uncapped, it grows until it fills the team. That single reframing does more for prioritization for gaming product teams than any scoring formula, because a formula cannot cap anything.
Studios reach for a formula anyway. It is the wrong instrument. The problem is not ranking. It is that one category of work never has to compete for its share.
Prioritization for Gaming Product Teams: Two Pools, Not One Ranked List
A time-boxed live-ops event and a progression rework are not comparable units of work, and putting them in one sorted list is what produces the outcome studios complain about. The event carries an external commitment, usually a date already announced to players. The rework carries a forecast. In any scoring model one input is a certainty and the other a projection, and the projection loses every time.
Scoring frameworks do try to represent that gap. RICE’s confidence term is the clearest attempt: per the tiers Intercom published and ProductPlan documents, an estimate backed by data scores 100%, one supported by softer evidence scores 80%, and a gut feeling scores 50%, with anything below 50% treated as a moonshot that should push priorities elsewhere. That multiplier halves a core-loop score honestly. It does not make the resulting number comparable, because the event it is being ranked against did not lose half its score for having a marketing date attached. Whether to use a scoring model at all is covered in the RICE scoring model.
That is why prioritization for gaming product teams needs two pools with separate capacity, scored independently and never merged into one list, rather than a better formula.
The Live-Ops Treadmill and Its Linear Scaling
Live-ops work has a specific shape, and the clearest description of that shape was not written about games at all. Google’s site reliability engineering practice defines operational work — toil — as work that is manual, repetitive, automatable, tactical, devoid of enduring value, and, most importantly here, scaling linearly as the service grows. Read that list against a live-ops calendar and most of it lands. An event is built, run, retired, and leaves the systems underneath it exactly as they were.
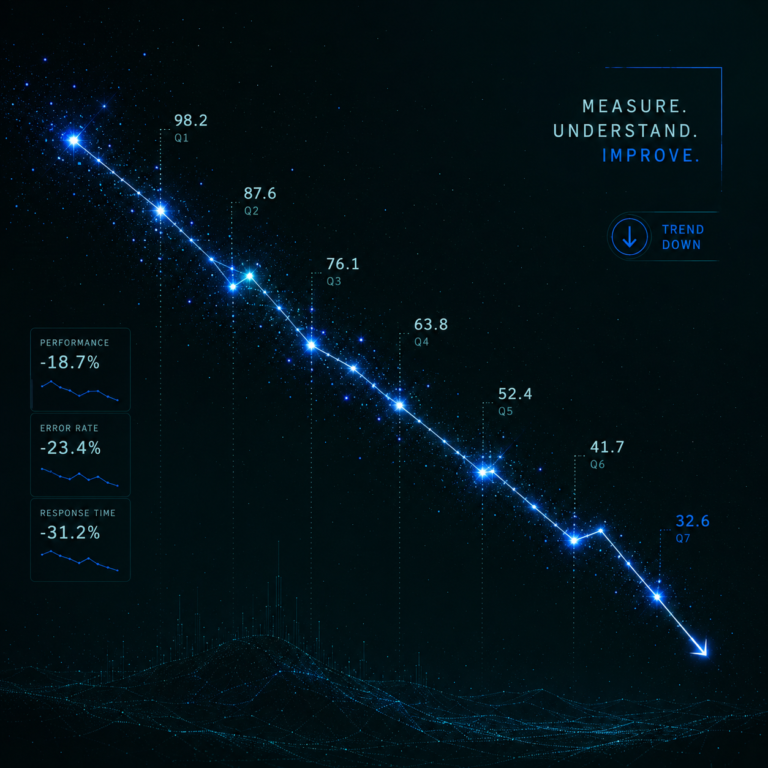
The consequence is stated plainly in the same book’s opening chapter: without constant engineering investment, an operations-focused group scales linearly with service size, which means hiring more people to do the same tasks repeatedly. That is the live-ops treadmill, and it is why the failure is invisible for so long. D1 retention holds, because acquisition and first-session onboarding have not changed. D7 can improve during a strong content quarter. What erodes is D30 and the long-tail curve, because the frictions that only surface after real time in the game are the ones nobody has capacity to touch.
Each event still produces a measurable spike. The spike just decays a little faster each cycle, stacked on a foundation that was never reinforced — the inverse of a game where the return mechanic is engineered into the loop itself, as in Duolingo’s retention engine. Nobody can point to the decision that caused it, because no single decision did.
A Capacity Cap Borrowed From Site Reliability Engineering
Google’s answer to the same structural problem is a hard number rather than a better argument. Operational work is capped at 50% of an SRE team’s aggregate time, and the cap is enforced by measuring where time actually went and then redirecting the excess back to the product development team until the load drops to 50% or below. The measurement window matters as much as the number: the target is averaged over a few quarters rather than checked per sprint, because operational work is spiky by nature. Quarterly surveys put the real average at about 33%, with individual outliers claiming anywhere from 0% to 80%.
Two details transfer directly to a studio. The first is that a floor set at the planning-cycle level and averaged over quarters survives contact with a launch date, while a floor negotiated sprint by sprint does not. The second is that the lower bound is set by the rotation itself, not by ambition: in a six-person on-call rotation, two of every six weeks are committed before anyone plans anything, a floor of 33%. A studio running a monthly event cadence has an equivalent unavoidable minimum, and it should be calculated before any percentage is promised to systemic work.
This is closer to how mature teams handle technical debt than to how they handle features: a standing allocation, defended structurally, not a line item that wins an argument each cycle. Inside the ring-fenced pool, discovery rather than scoring should set the order, because the team genuinely does not yet know which systemic fix matters most — the discipline continuous discovery exists to supply.
The Capacity Floor in Prioritization for Gaming Product Teams, Worked Through
Take a realistic case: a five-team studio on a live mobile title, roughly forty engineers, a monthly event cadence with two events already announced to players, and a progression wall that analytics has flagged three quarters running.
Start with the unavoidable minimum rather than the ambition. If running and supporting the announced cadence consumes the equivalent of 1.5 teams, that is 30% of capacity committed before planning starts. Ring-fence 25% for systemic work and the two figures total 55%, leaving 45% for everything else — new content, platform work, and the interrupts nobody schedules. Set the systemic floor at 40% instead and the arithmetic stops working, because the committed cadence and the floor together exceed what remains once interrupts are honest.
So the studio commits to 25% averaged across the quarter rather than per sprint, and descopes the second announced event from three modes to two to fund the first two sprints of the progression rework. It chooses against cancelling either event, which would break an external commitment, and against the 40% floor it would rather have, because a floor that cannot be held through a launch month is a floor nobody will believe next quarter. The event ships lighter. That is the trade, stated rather than discovered.
Where the Argument Stops Applying
Two boundaries are worth naming. A pre-launch title has no live-ops load to cap, so the whole framing collapses into ordinary roadmap sequencing. And a studio that has spent a year rebuilding a core loop nobody asked it to rebuild has the mirror-image problem: a ring-fenced pool with no discovery discipline inside it produces expensive systemic work that moves nothing, which is the same failure wearing the opposite costume.
The number to watch is not this quarter’s event performance, which will look fine. It is the ratio of each event’s lift to the lift of the comparable event two cycles earlier, read as a trend rather than a result — the kind of figure a quarterly metrics review exists to surface. When that ratio has declined for three consecutive events while the calendar has stayed full, the treadmill is already running, and the capacity allocation of the previous two quarters will explain why.
References
- Google — “Site Reliability Engineering,” Chapter 1: Introduction, Benjamin Treynor Sloss, on the 50% cap on aggregate operational work and the linear scaling of ops-focused teams, fetched 7 August 2026 — https://sre.google/sre-book/introduction/
- Google — “Site Reliability Engineering,” Chapter 5: Eliminating Toil, Vivek Rau, on the definition of toil, the 50% target averaged over quarters, the measured 33% average, and the on-call rotation lower bound, fetched 7 August 2026 — https://sre.google/sre-book/eliminating-toil/
- ProductPlan — “RICE Scoring Model,” documenting Intercom’s published confidence tiers of 100%, 80%, and 50%, fetched 7 August 2026 — https://www.productplan.com/glossary/rice-scoring-model